Solar‑Meter‑Cloud
SolarMeterCloud is a private open‑source project developed by Colmuspro in spare time. It was created from the desire to present solar data in a transparent and openly accessible way — using open tools that anyone can understand, verify, and extend.
The project is intentionally designed to be somewhat ambitious: Colmuspro aims to demonstrate what is possible with open‑source tools while gaining experience that may eventually support a transition into freelance work. All development takes place alongside a regular full‑time job and is expanded step by step.
It is important to Colmuspro that the project remains open, well‑documented, and usable or extendable by others — fully in the spirit of open source.
Who is Solar‑Meter‑Cloud for?
Solar‑Meter‑Cloud is intended for anyone who wants to:
clearly visualize their solar installation — from balcony systems to larger setups
observe long‑term energy trends
work on a technically oriented DIY project
Installation of the Energy Meter
The installation of an energy meter must always be carried out by a certified electrical company. Work on electrical systems must not be performed by untrained individuals.
While Solar‑Meter‑Cloud is aimed at technically interested users, it assumes that all safety‑relevant installations are carried out professionally and in compliance with electrical standards.
Download: Code and Wiring Diagram
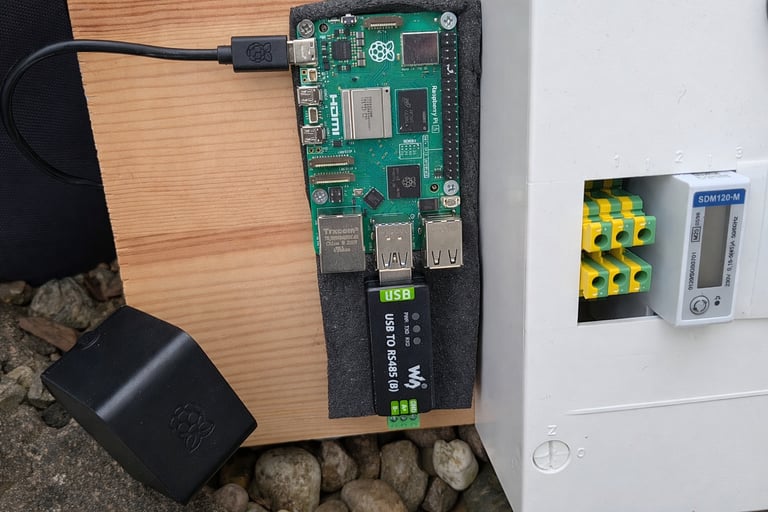
Bill of Materials
1× distribution box with DIN rail, approx. 30 × 30 × 15 cm
1× Raspberry Pi 5 Model B, 4 GB, 4 × 1.5 GHz
1× Raspberry Pi® power supply
1× SDXC card, 16 GB, Class 10
1× EASTRON SDM120‑Modbus energy meter
Display of Current PV Measurements
Commercial systems often highlight the generated solar energy. SolarMeterCloud adopts this principle and visualizes both the current output of the photovoltaic system (PV system) and the cumulative energy production since the first day of operation. Based on these values, the estimated CO₂ savings can be calculated. This provides a clear, open, and app‑independent presentation of the most important key figures.
Voltage
Current
Active Power
Frequenz
Import Energy
Export Energy
Current Values in the MQTT Broker
MQTT Topics for Current Measurement Values
SolarMeterCloud/Solar/Meter/VoltageS30001
SolarMeterCloud/Solar/Meter/CurrentS30007
SolarMeterCloud/Solar/Meter/ActivePowerS30013
SolarMeterCloud/Solar/Meter/FrequencyS30071
SolarMeterCloud/Solar/Meter/ImportEnergyS30073
SolarMeterCloud/Solar/Meter/ExportEnergyS30075
Statistical Daily Performance Values
For each day, an individual measurement is generated for the minimum, maximum, and average performance. This makes it easy to see how stable the system operates and how strongly the performance fluctuates throughout the day due to seasonal changes, sunlight intensity, and weather conditions.
The system always stores the last 30 days. When a new daily value is added, the oldest entry is automatically removed and the new value is appended to the end of the list. For the homepage display, this means that a rolling 30‑day period is always visible.
In Google Sheets, however, all historical data remains fully available and is never deleted. The complete long‑term history is preserved there.
Access and Display Options
SolarMeterCloud supports three different variants for displaying and using the collected data. Depending on your application, you can decide which variant you need and which ones you do not require.
Variant 1: Node‑RED Dashboard (Local Display)
The data is displayed exclusively through the Node‑RED dashboard within the home network.
Access only within the local network
No public display
Data logging is possible but not covered here
Can be used with or without authentication
This variant is suitable when the data should only be visible internally.
Variant 2: Google Sheets (Private Cloud Access)
The data is automatically stored in Google Sheets.
Accessible from anywhere
Data access is not public
Google always requires authentication
All historical data remains fully preserved
This variant is ideal if you want to view your data while on the go but do not need a public display.
Variant 3: Google Sheets + Website (Public Display)
The data is stored in Google Sheets and additionally displayed publicly on a website.
Anyone can view the data
Ideal for projects that require transparency or public visualization
Google Sheets remains private; only the published chart is publicly visible
This variant combines the advantages of cloud storage with a public presentation layer.
Authentication
Variant 1 (Node‑RED): optional, with or without authentication
Variant 2 (Google Sheets): authentication required
Variant 3 (Website): authentication can also be used, but it is not part of this description
Contact
Questions about Colmuspro? Write to us.
info@colmuspro.eu
© 17.04.2026. All rights reserved.